ggvis
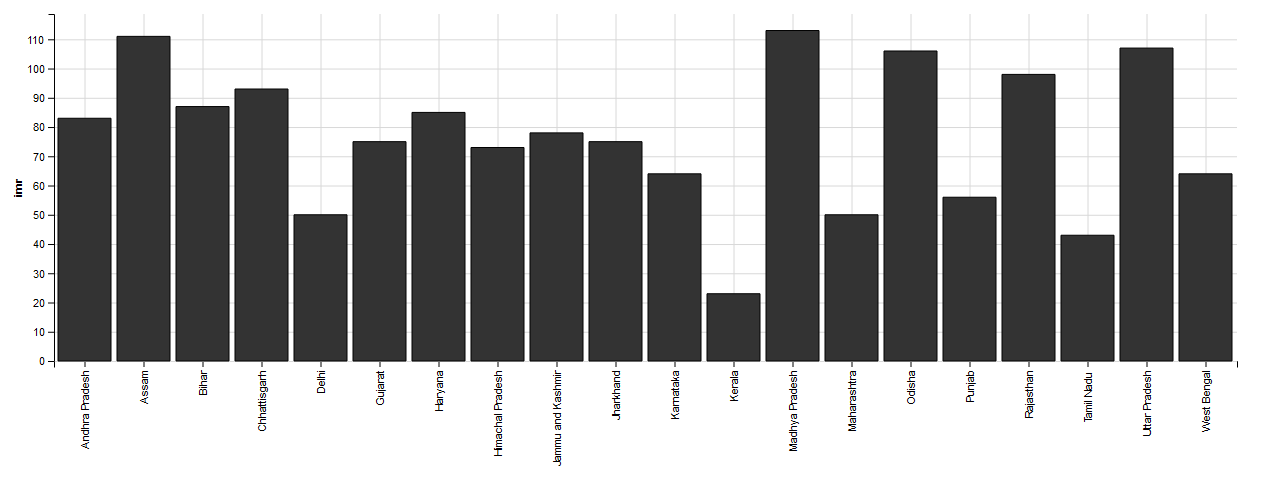
- Data: Infant Mortality Rates (India and major states) by Sex - 2001 to 2012
- Data Source: NRHM
- Download Data
Note
You can download the full R Script to reproduce the analysis here.
Warning
ggvis is still under development (currently version 0.4.2), so some functions might not work as well as we would like them to.
Install / load required packages using:
# Check to see if packages are installed. Install them if they are not, then load them into the R session.

ipak <- function(pkg){
  new.pkg <- pkg[!(pkg %in% installed.packages()[, "Package"])]
  if (length(new.pkg))
    install.packages(new.pkg, dependencies = TRUE)
  sapply(pkg, require, character.only = TRUE)
}

packages <- c("dplyr", "xts", "lubridate", "tidyr", "ggvis")
ipak(packages)
Set file paths:
#Set file paths

ROOT <- "FULL_FILE_PATH"   #Note that you need to replace \ with /
DATA <- paste0(ROOT,"data/")
OUTPUT <- paste0(ROOT,"output/")
#---------------------------------------------------------------------
Read CSV file:
imrData <- read.csv(paste0(DATA,'IMRsex2001-2012.csv'))
Prepare data for analysis:
imrData <- imrData %>%
  select(state = India.States.Uts,
         X2001.Total:X2012.Female) %>%  #Keep selected variables
  gather(yearSex,imr,X2001.Total:X2012.Female) %>%    #Reshape data
  separate(col = yearSex,
           into = c('year','sex'),
           sep = "\\.",
           remove = TRUE) %>%         #Split yearSex column into year and sex columns
  filter(sex != 'Total') %>%          #Remove observations of category 'Total'
  mutate(year = as.Date(paste0(substr(year,start = 2,stop = 5),'-12-31')))   #Remove 'X' at the beginning of year, convert variable into date.
Plot bar graph:
imrData %>%
  filter(state != 'INDIA',year == max(year)) %>%
  mutate(state = as.character(state)) %>%
  ggvis(x = ~state,y = ~imr) %>%
  layer_bars() %>%
  add_axis("x",title = "",
           properties = axis_props(labels = list(angle = 270,
                                                 dy = -5,
                                                 align = "right")))
Output
Tip
ggvis enables you to add basic interactivity to your visualizations. RStudio has excellent tutorials for ggvis.